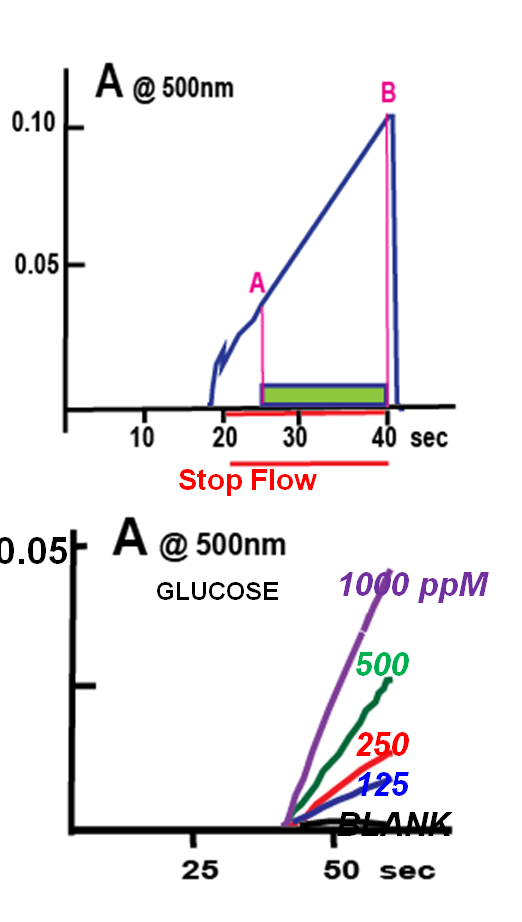
There are two ways in which the reaction rate response can be recorded and evaluated:
- By using the maximum point (B) of the entire response curve.
- By selecting only the linear section and measure its slope, or only the point at its maximum.
Using the entire response curve is,the preferred option for very fast reactions, since by the time when reaction mixture reached the flow cell, the equilibrium has almost been reached and there is only a small signal increase to be gained during extended stopped flow period. The assay of nitrite is an example of such situation (2.2.14).
Selecting only the linear section of the response curve eliminates background of sample and reagent – an advantage if sample and/or reagent absorb at the same wavelength as the formed product. The assay of glucose (Carroll et.al) as well as the phosphate assays (2.2.18. and 2.2.19.) are examples this, second approach.
A.Carroll et al. J. Flow Injection Anal., Vol. 24, No. 2 (2007) 103
Stop Flow Response Curve
2.2.11.


